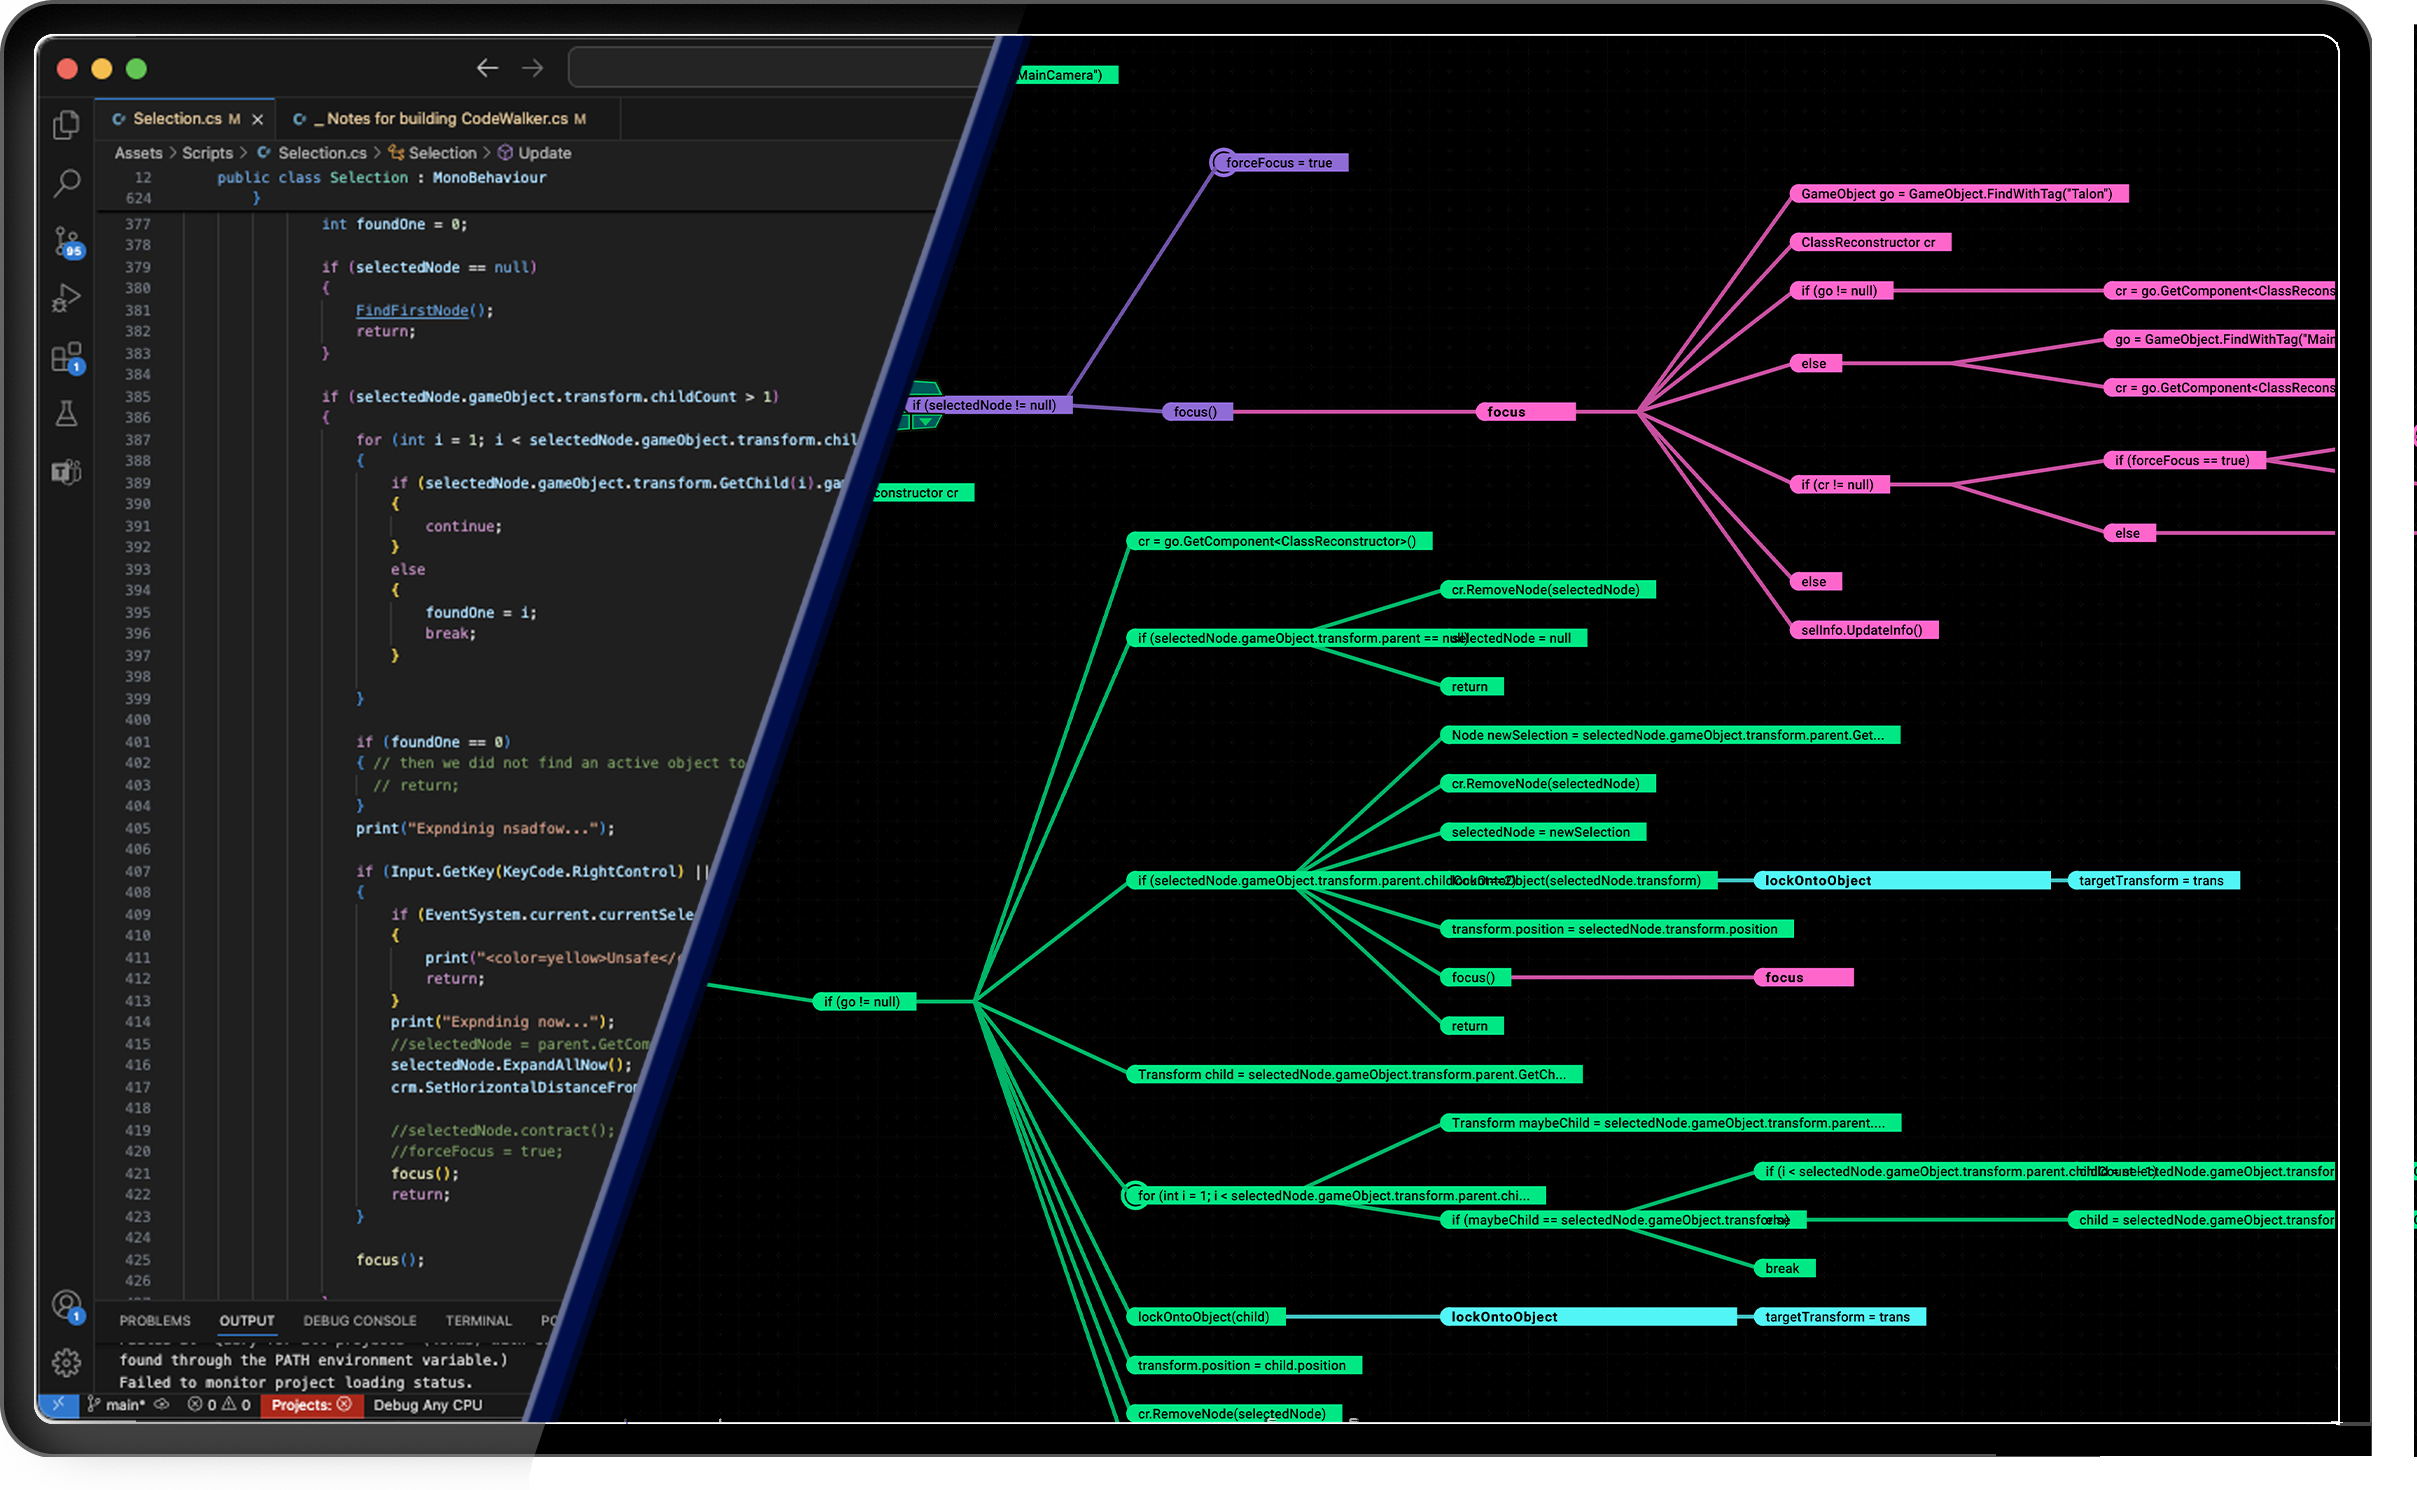
A detailed 2D view of the logic, dependencies, and other information about a single file. Microscope™ includes Retrace™, a visual debugger that lets you scrub forward and backward in time, providing unprecedented insight into your code's execution flow and making debugging more intuitive than ever.
Step forward and backward through your code execution with precise control, identifying exactly where and when issues occur in your program flow.
Retrace™ lets you see your code's execution as a visual timeline, making it easy to understand complex program flows and identify the root causes of bugs.

Hunting down random, seemingly untraceable bugs is tedious and time consuming. It is also vital to shipping a stable product.
CodeWalker™'s Retrace™ lets you collect data on even a production product and play back the executed logic. The ability to scrub forward and back in time while visually observing how a product works will make short work of even the most elusive bugs.

The Heat Map filter tracks down loops and colorizes a logical spire based on the number of times it passes through a higher level loop, instantly showing you what parts of your code need to be the most efficient.
Since one piece of code can call another piece of code in a different file, you probably aren't aware of exactly how many loops surround some parts of your code. This often leads to performance problems. CodeWalker™ visually and instantly shows you what parts of your code need to be the most efficient.
Start using Microscope™ today and make debugging intuitive, visual, and more efficient.