CodeWalker™ is like a traffic map for your code. It will transform how you understand, debug, and optimize your codebase. Change your perspective, and see the inner workings of any code
A powerful 3D visualization of your entire codebase. Recon™ gives you a high-level overview of all your files and how they interact with each other. Navigate through complex projects with ease and identify dependencies, bottlenecks, and patterns that would otherwise remain hidden.
Learn MoreExperience your codebase like never before with intuitive 3D navigation. Zoom, rotate, and filter your view to quickly identify key connections and dependencies.
Get a clear visual representation of your file hierarchies and understand relationships between different components of your application at a glance.
Instantly see how files and modules interact, identify circular dependencies, and understand the impact of code changes before you make them.
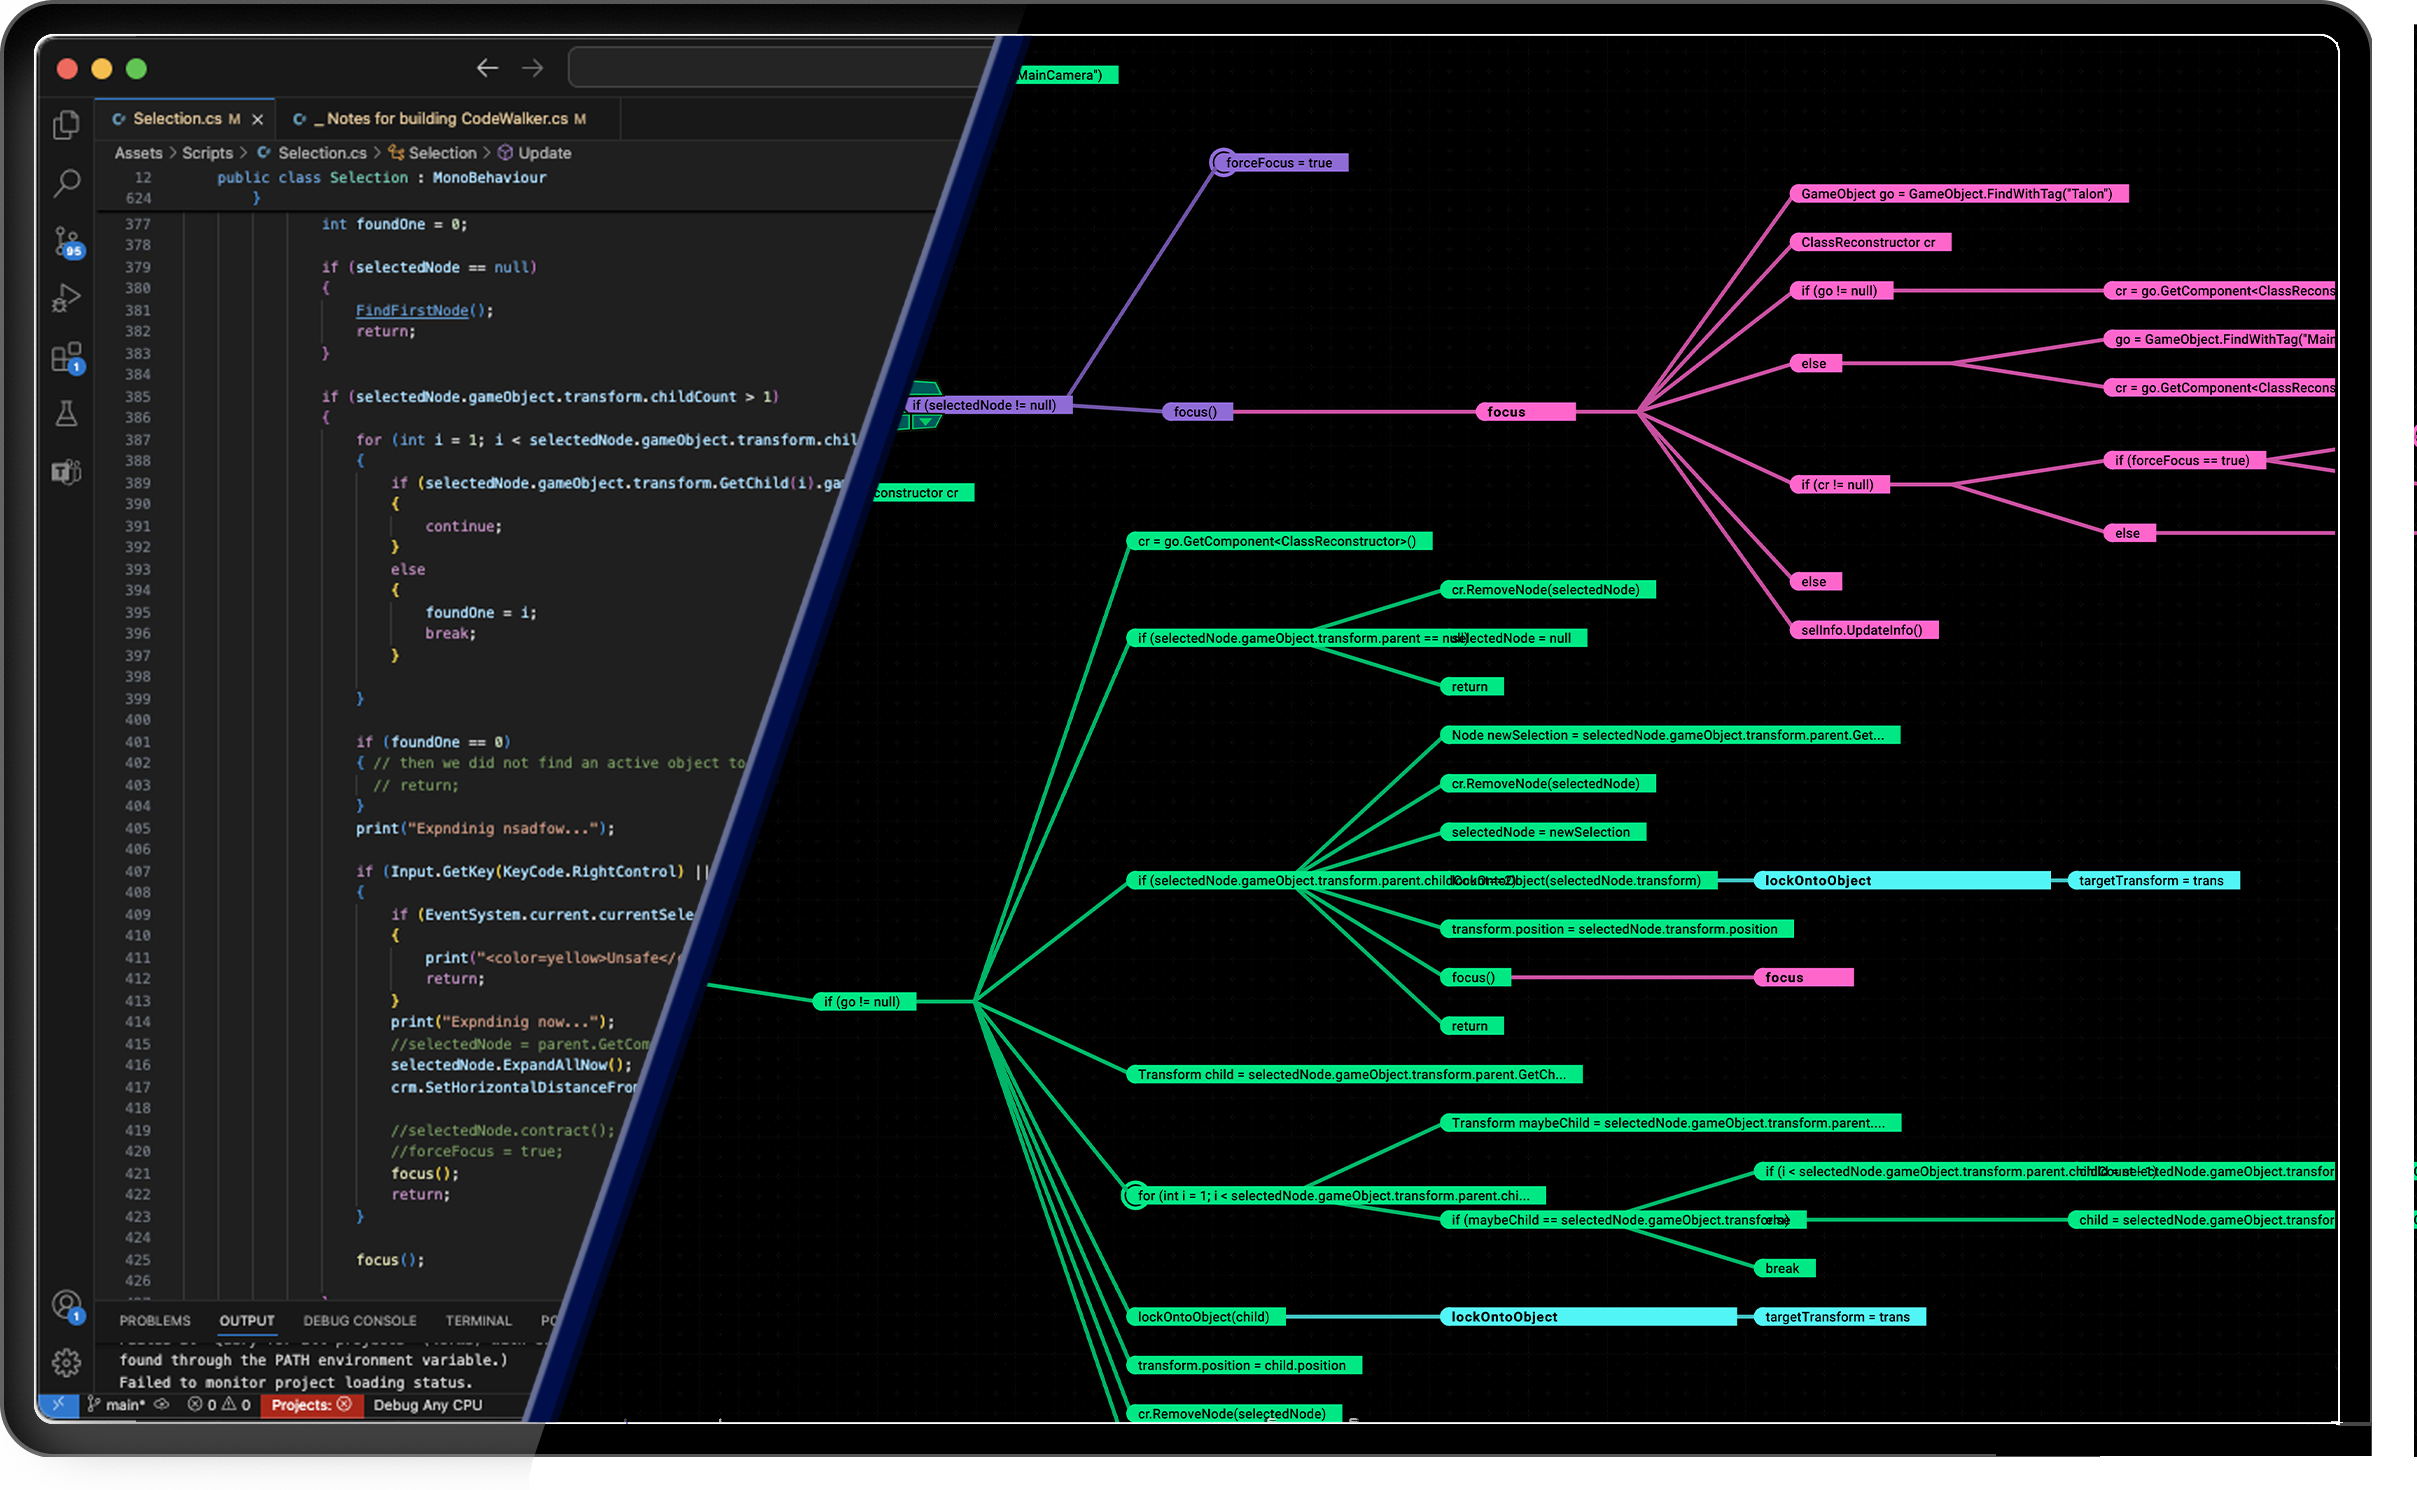
A detailed 2D view of the logic, dependencies, and other information about a single file. Microscope™ includes Retrace™, a visual debugger that lets you scrub forward and backward in time, providing unprecedented insight into your code's execution flow and making debugging more intuitive than ever.
Learn MoreStep forward and backward through your code execution with precise control, identifying exactly where and when issues occur in your program flow.
Hunting down random, seemingly untraceable bugs is tedious and time consuming. It is also vital to shipping a stable product. CodeWalker™'s Retrace™ lets you collect data on even a production product and play back the executed logic.
The Heat Map filter tracks down loops and colorizes a logical spire based on the number of times it passes through a higher level loop, instantly showing you what parts of your code need to be the most efficient.

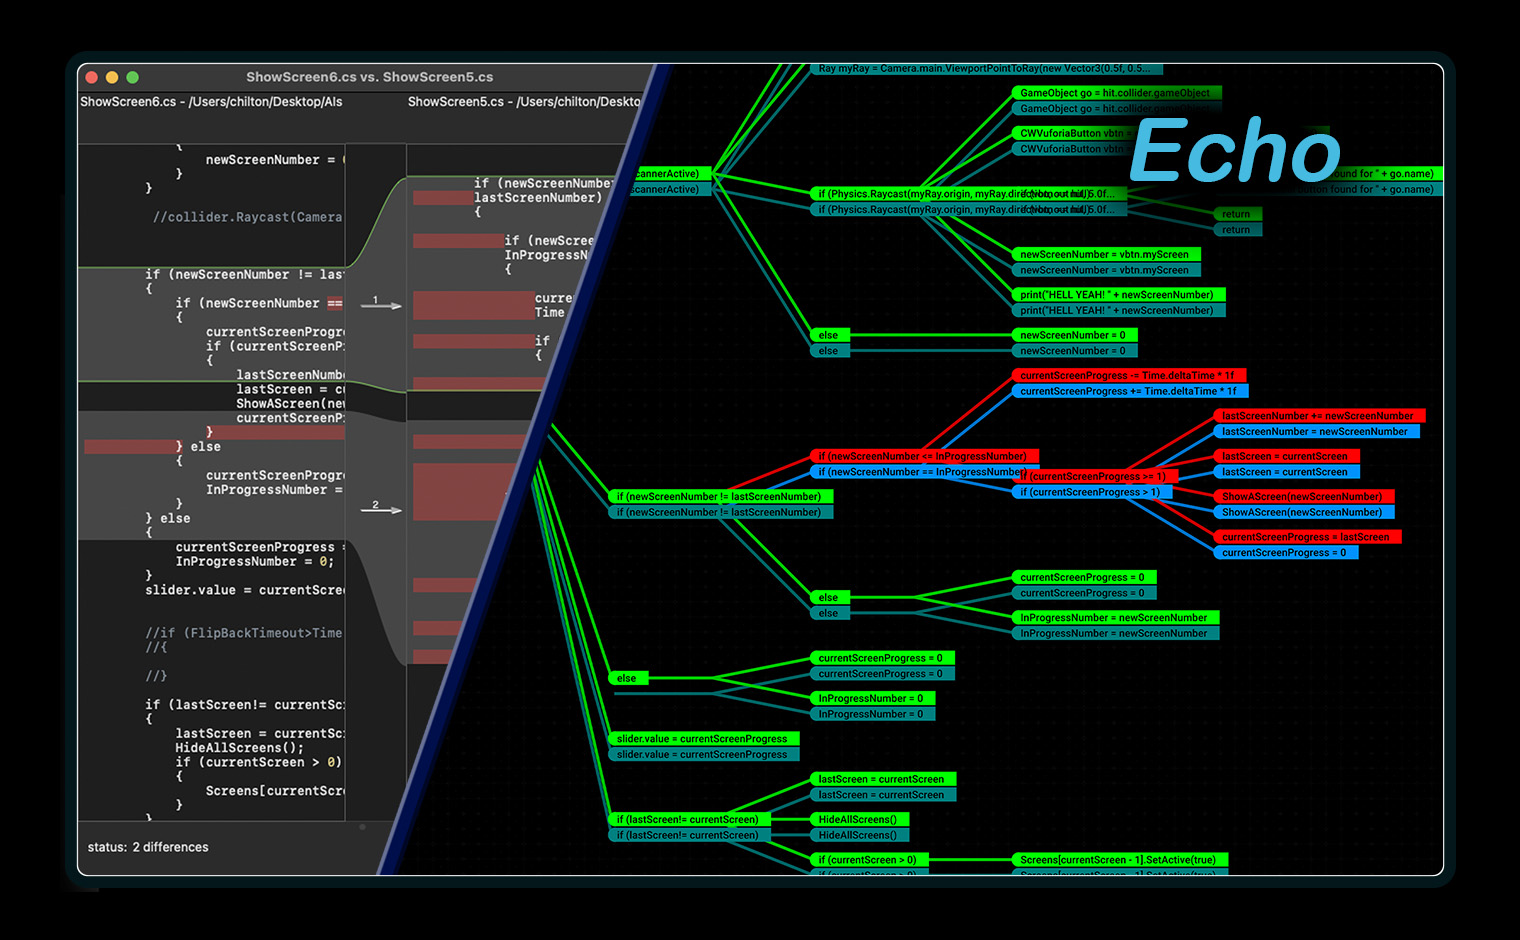
Echo™ combines Microscope™ with powerful diff capabilities, showing you visually how two files are different. Unlike text-based diff tools, Echo™ can show you the effects of a change on the logic of your code, giving you a much better understanding of potential issues that might arise before they become problems.
Learn MoreSee the real impact of code changes on program logic and execution flow, not just text differences. Understand exactly how modifications affect your application behavior.
Go beyond line-by-line comparisons and see how changes impact the actual operation of your code, with intelligent highlighting of affected execution paths.
Every time a language or platform is updated, code deprecation occurs. While all development environments help you see what was deprecated, only CodeWalker™ shows you where.
Hunting down random, seemingly untraceable bugs is tedious and time consuming. It is also vital to shipping a stable product. CodeWalker™'s Retrace™ lets you collect data on even a production product and play back the executed logic. The ability to scrub forward and back in time while visually observing how a product works will make short work of even the most elusive bugs.
Every time a language or platform is updated, code deprecation occurs. While all development environments help you see what was deprecated, only CodeWalker™ shows you where. This lets you make better, more informed decisions, like whether it's better to update a section of deprecated code or just replace it entirely.
The Heat Map filter tracks down loops and colorizes a logical spire based on the number of times it passes through a higher level loop. Since one piece of code can call another piece of code in a different file, you probably aren't aware of exactly how many loops surround some parts of your code. This often leads to performance problems. CodeWalker™ visually and instantly shows you what parts of your code need to be the most efficient.
CodeWalker™ is available for all major platforms. Download a free trial today!